
Problems with Power BI – Fiscal Year Issue
Problem
There are some problems with Power BI (See Business Intelligence) which include having an issue in displaying statistics in the report according to the fiscal year which I had set in the Timeline Slicer tool.
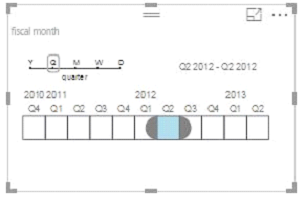
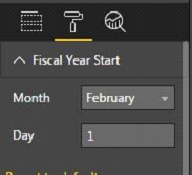
Let’s review in details of the problem by going through diagrams of Power BI report. The fiscal year set in the Timeline Slicer starts from 1st February.
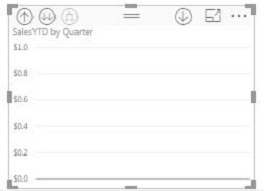
Timeline Slicer Chart
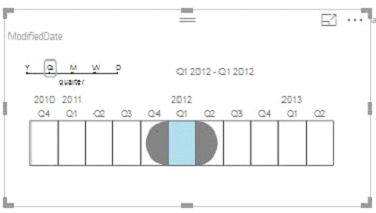
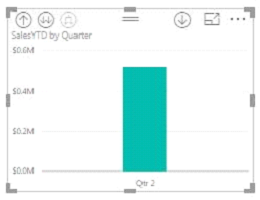
As you can see from the pictures I have selected Q1 of the year 2012 but the chart displays statistics of Q2 which is invalid.
Timeline Slicer Conjurations

Solution
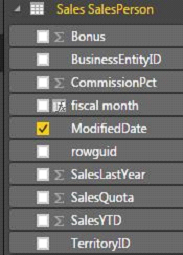
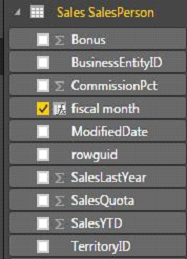
Let’s suppose the fiscal year of my organization is starting from 1 February and finishing on 31 January. As we all know that normal year starts from 1 January and ends on 31 December. So, In order to solve this problem, I added a new column manually and renamed it ‘fiscal months’. The above-mentioned example is pointing out that 1st month January in the normal year will be equal to the 1st month February of the fiscal year which is actually the 2nd month in the normal year. Considering this, in my new column of “fiscal months”, I adjusted this ratio and then I used the fiscal month column in my report with timeline slicer to fix this problem.
Read 6 signs you need a Business Intelligence solution
The following table shows the adjustment of the fiscal year start against the normal year according to the above-mentioned example:
S/N
Fiscal Year
Normal Year
1
February
January
2
March
February
3
April
March
4
May
April
5
June
May
6
July
June
7
August
July
8
September
August
9
October
September
10
November
October
11
December
November
12
January
December
The following diagrams show the correct data in the charts. No matter which quarter I select in the Timeline Slicer, the charts will show the correct statistics.
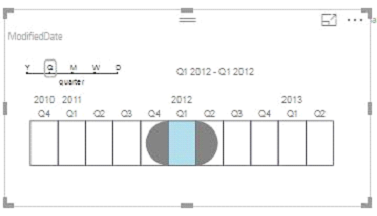
Now, after the Solution, I have selected Q1 of 2012 and as you can see from the diagram of the chart, it is not displaying any value. The reason is that Q1 does not have any record. Let’s see by selecting Q2 to check if solution is working fine or not.
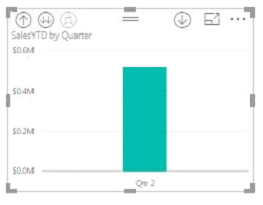
Now, as you can see from the diagrams Q2 is selected in the timeline slicer and chart is also displaying Q2 which means our solution is working fine.
Timeline Slicer configurations with new column
Related Posts
 Shopify, Magento, WooCommerce: Which Is The Best Choice For Your Online Store?
 How to find someone’s email address
 Integration Practice: Solutions to 3 high-level challenges that Integation practice leads come across
 Hadoop Foundation: When to use Hadoop for a Data-driven enterprise?
 Planning a new Integration platform (with Microsoft technologies)
 What Are The Best Practices For Creating A Software Development Plan