Big Data Hadoop Stack Training [Short Videos Part II]
Big Data training: Theory behind Big Data Part II
“Data scientist is the sexiest job of 21st century”, as quoted in an article in Harvard Business Review written by D.J. Patil (former data scientist at LinkedIn) and Davenport, senior adviser at Deloitte Analytics.
This is just half the story, and probably the shining half. The other half is that data scientists have to pour a lot of their brain into getting their job done. From the science & engineering of big data to the operations & security of big data, you’ll have plenty thrown at you (unless you just want to be a Hadoop administrator for the rest of your life).
Following is a quick 20-minutes training session on fundamentals of Big Data to help you get prepared for the sexiest job of 21st century 😉 This is Part 2 (includes four volumes of short videos) of the Big Data Hadoop Stack training by Khurram M. Pirzada, Hadoop lead at Allied Consultants. Part I of our Big Data training can be viewed here.
Target audience: Each volume embedded below highlights the fundamentals involved in Big Data projects. The training is geared towards mid/senior level BI and integration consultants who wish to branch out in the Big Data field.
In the theoretical parts of this training (Part I, II & III), we use a high level of abstraction for participants to understand the underlying motives, opportunities, risks & factors associated with distributed large scale computing& big data projects.
Constituents & Science of Big Data: Vol 1
Video transcription Vol 1
Data within the Big Data domain has implicit & explicit relationships. What does having implicit & explicit relationships mean here? It means that sometimes different data churning systems are coordinating or generating multiple data sets whereas sometimes these systems (ERPs, CRM, Automated manufacturing systems) are dependent on each other for generating a collective data set.
Sometimes, the type of relationship between data sets is merely transactional, event or task based. It means that, in some cases, two (or more) data churning systems directly collaborate to accomplish a task. Data sets are dimensional in a big data environment, and we can use them for future forecasting. Systems also generate multi-functional data and have the capability to adapt as per the functional requirement.
Example: In this case, we can take the example of logistics. Assume that we have a consumer base, a processing base, and we have a receiver here.
The typical Big Data generated by the processor base is of multiple types as well as dynamic, and it has multifunctional roles. The data being generated here at the processor end has direct & indirect mapping. On the consumer base, each sector/base/action generates different sets of data which has to be communicated directly, or indirectly, between the data sets, multiple data sets or competing data sets.
For example, a data set that travels from the consumer base to the destination have direct relationship mapping in terms of its delivery. Otherwise, only the processor base keeps track of all requirements to process this data from point A to C. Processor base also keeps track & trace of all competing data sets.
Data engineering: When we’ll deploy the sandbox (Hortonworks & HDInsight), we’ll also see how to engineer the data. This is a big question that, whether data can be engineered? Yes, it can be engineered for different purposes in different market segments by using the data science techniques & technologies.
In a typical market, if you want to introduce a new product, you can use speculative mechanisms based on which you can implement approximation based on your previous service record. We then project or predict future demand/supply/events based on algorithms that are based on variety of data sets as well as previous service records.
In a live Hadoop environment, we capture the data of specific market segments and user areas (based on our initial assumptions), and visualize that what type of significance we can achieve from the data. We then analyze, discover, predict, recommend and prevent any kind of action that may impact overall business or specific business function.
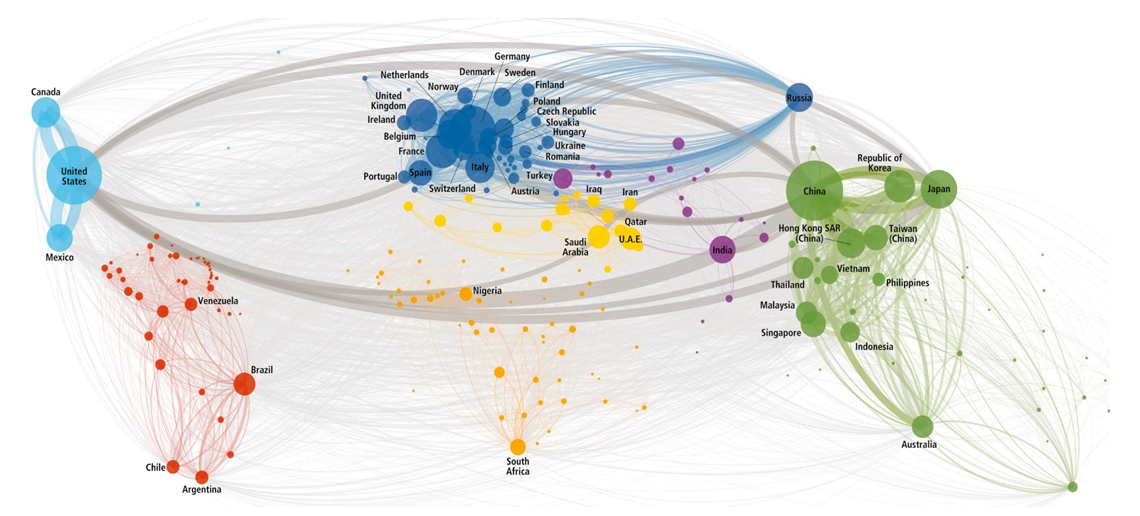
The figure below is a typical example of movement of goods between different regions. All the bigger nodes within this diagram show the set of operations. The diagram clearly shows Europe as a central hub of goods movement with highest number of populated nodes. Then comes the Far East Asia, North America, South America. All the extended edges provide the specific information regarding transportation & movement of goods along with different data sets that are generated. All data mapping is clearly indicated within this context of inter-continental movement of goods.
Vol 2: Business & Operations of Big Data
Video transcription Vol 2:
Business & Operations of Big Data
Now we’ll cover the business aspects of data. We all know that data, unless it creates some sort of value stream does not hold a lot of value. Therefore, any data and process that generates business process automation insights results in a lot of interest from business executives (CFOs, CIOs & CEOs). We also want to see how data is impacting the business and vice versa.
There is always a ‘triology’ of love between customers, business and data. Businesses are interested in dollar value of the solution (or product), whereas customers are interested in consumption of these products or services. When we ask that who drives what, there is no simple answer. Probably, that is why it is called the trilogy of love as all three are interdependent.
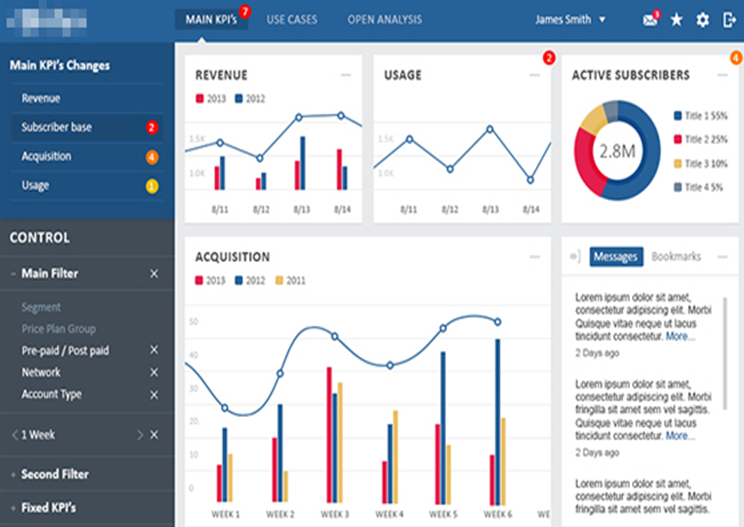
The figure below shows the comparison between the usage of data, the revenue it has earned for the business and how we can turn that into some kind of value stream.
So, what is the real benefit of having such large data sets in a big data environment? The best answer is that we get real-time insight about the business operations. We also come to know how the data sets within the big data environment are collaborative or competing with each other in terms of acquisition. We also need to remember that the operations on these big data sets are always resource intensive. We need an elaborate infrastructure and other resources (both human & capital resources).
Another question is that while operating the Hadoop cluster or any big data technology, can we use multiple techniques to deliver results. Yes. Fortunately, we have to use multiple techniques and technologies within Big Data environment for its adaptability and optimization. However, we need to make sure that there are multiple entities giving their input for processing.
Smart city concept is a perfect example of big data application. The figure below shows that we have government, environment, utility services, transportation, citizenry, and other allied services. We can deal with all these entities as a single cloud-based entity where all the operations have to collaborate.
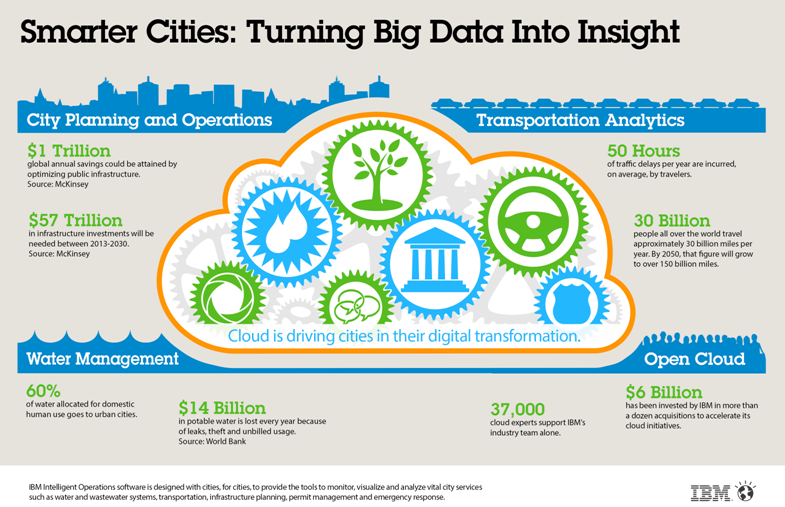
Thus, smart city gives us a perfect example of different government & business entities collaborating with each other, generating a lot of data, and this framework can be used to deliver insights regarding each sub-entity.
Vol 3: Security & Audit Trail importance in Big Data
Video transcription Vol 3
Security & Audit trail of data
Now we shall discuss the security and audit of data. Knock knock, who’s there? We always want to make sure that what type of data has been given what type of access. We do not want to give unauthorized access to any of the data sets that are not meant for that purpose. We’ll see how to track and manage audit trail. For example, the logistics example that we were discussing before, at any given point, the consumer wants to track the location of shipment. So, all they should be able to see is the relevant information with the current status. Or another setting is that a processor wants to see the exact current status of shipment, the system should allow so.
We also have to make whole data life cycle. We want to ensure the life cycle to start from the first point of contact where information is generated till the end. We also see that our data life cycle should contain all relevant policies, procedures, governance rules, authentication and authorization. We also want to make sure that any or all possible isolation or deconstruction of intrusion are incorporated within those policies.
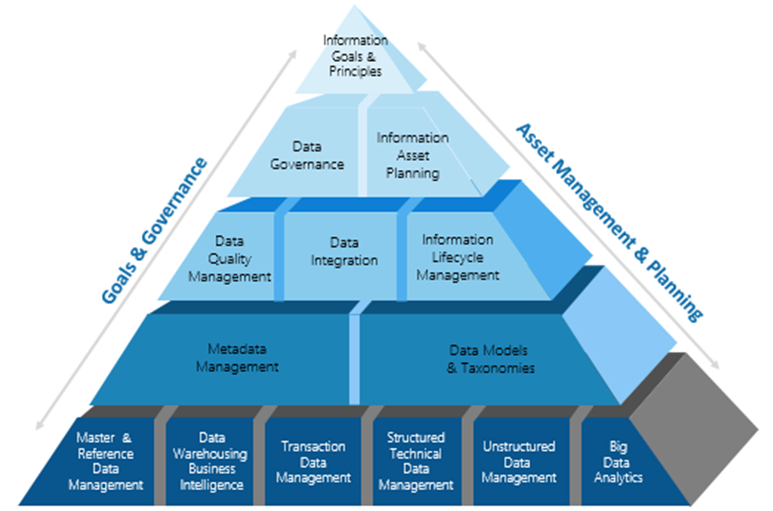
In terms of managing security of our big data environments, we have below the pyramid-like picture of whole set of management & planning, and goals and governance. The figure shows that at the top we have rules & regulations that can be divided into data governance and asset planning. As we go down our security pyramid, we bifurcate all data sets into different fragments so that each policy set is applied to each data set (produced through an event- or task-based model).
Our security portfolio within big data environment has a complete ring around it. The figure below shows that main components of this ring are identity and access control mechanisms, making sure that infrastructure is resilient for execution. If the client is using cloud services, we make sure that these services are secure and prone from external threats.
If there are any mobility issues, we make sure that not only the components are secure but also their interaction. We also ensure a larger perspective on governance and risk compliance. We particularly make sure that there are no leakages or fraud attempts. The purpose of this security model is also to ensure a sustainable secure deployment and operations of Hadoop technologies.
Vol 4: Context aware data & collaborative filtering aspects in Big Data projects
Video transcript Vol 4
Data relationships in Big Data
Data to data relationship, data always believes in relationships, whether the data is generated is between the same entities or with the collaboration of other resources. It implies that data scientists always create relationships. These relationships could be context-aware, or they could be co-working.
Sometimes, when the data sets are being generated, it is only transactional, at times it is collaborative, and sometimes it is for very specific task. For example, the logistics case we discussed earlier, is a perfect example in creating relationships. The current status of a parcel is Miami, the next will be New York. The Miami data set will not only update and collaborate with New York, but also with the destination source in Vancouver. So, these data sets are not only co-working but also remaining update about the current situation.
Usually, one data layer helps build another top layer. For example, you are tyring to develop a certain solution that can be used for predictive maintenance. So, irrespective of the data source, social, government or by business . Their services are interdependent. The next session for our Big Data training will mark the end of theory and fundamentals of Big Data. We will then move on to the big data live environment.
Part III of our Hadoop stack training will be published during the next week. Starting from Part IV of the training, we will install any open source sandbox for our Big Data demonstration (Hortonworks/Cloudera). We will also install Microsoft HDInsight for those who want to develop their Big Data solutions within the .Net environment.
To continue, please visit Part III of the Big Data Hadoop stack training.
You may like
A questionnaire to self-discover Big Data maturity stage
Downloadable Big Data Pilot Project Template
Related Posts
![Big Data Hadoop Stack Training [Short Videos Part III]](https://alliedc.com/wp-content/uploads/2015/09/DataScienceDisciplines-150x150.png) Big Data Hadoop Stack Training [Short Videos Part III]
Big Data Hadoop Stack Training [Short Videos Part III] Exploring The Best Open-Source Blockchain Platforms
 Problems with Power BI – Fiscal Year Issue
 Top 10 questions that can help discover the value of Internet of Things for any business
 BizTalk Migration to Azure iPaaS – Considerations-Part 3
 Compensation Models For Partners in Consulting Firms