What are the Benefits of Dashboards to an Organization?
What is a Dashboard?
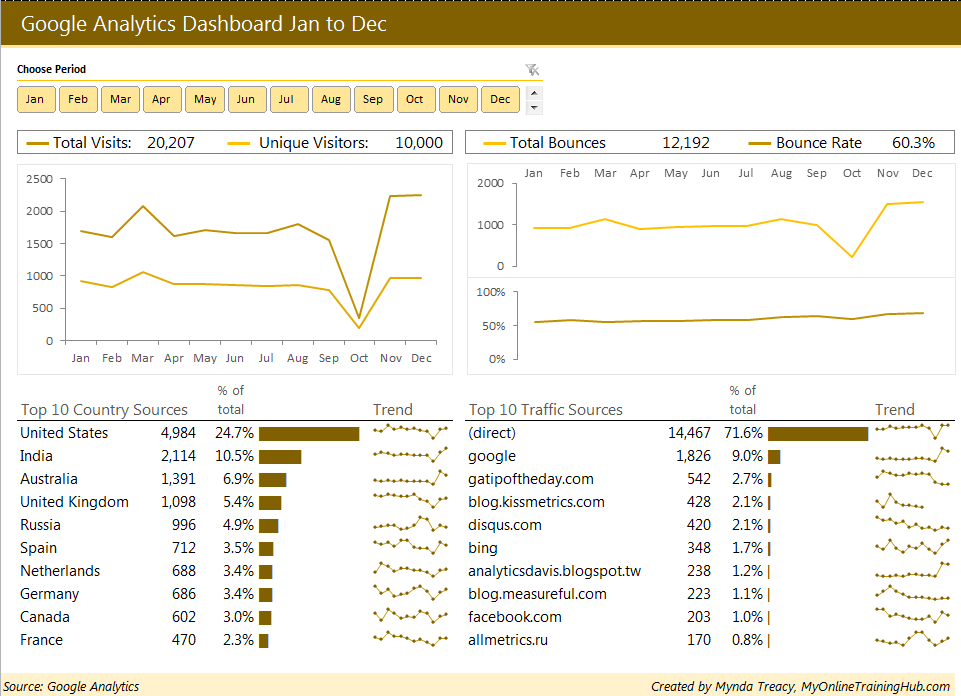
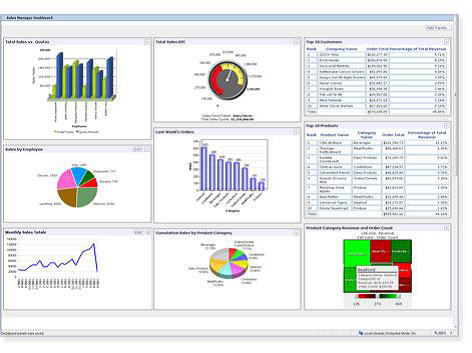
A Dashboard is a visual display of the most important information needed to achieve one or more objectives; consolidated and arranged on a single screen so the information can be monitored at a glance.
A user interface that organizes, integrates, and presents mission-critical information, pulled from multiple sources to users in a way that is easily read and understood.
Performance Management: Process of measuring progress toward achieving key goals and objectives in a manner designed to optimize organizational performance.
Business Intelligence (BI): The tools, techniques, and processes involved in turning data into information, and information into knowledge in a manner designed to optimize decision-making. BI encompasses technologies for data warehousing, data mining, data integration, reporting, and analysis.
- Dashboards integrate and synthesize Performance Management and Business
- The combination of Performance Management and Business Intelligence can provide a powerful new way to communicate strategy within an organization and monitor and analyze organizational activity.
Dashboards, if properly designed, can help you manage your operations more effectively and efficiently.
Read Power BI Basics – Power BI Tutorial For Beginners
A properly designed dashboard caters to the needs of the user and is built around well-defined requirements and specification
The user must play an integral role in developing the requirements specification
Dashboards Characteristics
Three Primary Applications:
- Monitoring
- Analysis & Reporting
- Management
Three Layers: Most distinctive feature. Allows users to peel back layers of information to get to the root cause.
- Graphical abstracted data – designed to help monitor key metrics
- Summarized dimensional data – designed to help identify root causes
- Detailed operational data – designed to help identify needed corrective action
Three Types:
- Operational Dashboards – emphasize monitoring
- Tactical Dashboards – emphasize analysis
- Strategic Dashboards – emphasize management
Dashboard Benefits
- Communicating and managing strategy: Dashboards can serve as agents to help Organizational change.
- Monitoring and oversight: Dashboards can provide each group of users with information and analytical capability that tailors and is appropriate to their role.
- Consistent view of the organization: Dashboards can provide an organization with a single, concise and common vision of truth.
- Timely delivery of actionable information: If designed and used properly, Dashboards can deliver the right information to the right user at the right time to help decision-making, enhance efficiency and accelerate bottom-line results
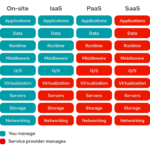
- Integration of data from multiple sources: BI tools allow data from multiple data silos to represent on a single Dashboard
- Reduced costs and redundancy: BI capabilities can help analysts to gain quick insights from large amounts of data in ways that would be otherwise impossible or cost prohibitive.
- Root Cause Analysis: The dashboard can allow users to drill down into the details when abnormal trends spotted in the summary reports.
Advancing organizational maturity: Dashboards give a clear view of key data points that may be used to assess the organization’s progress toward specific goals.
Feedback from a dashboard user
- “What’s best about the Dashboard designed for us is that it made our high speed and low drag relative to the painful process we used to follow to generate performance information. What’s more, by making the metrics so easy to get to with just a few clicks of the mouse, the Dashboard has helped us socialize and internalize our focus on performance.”
Dashboard Deployment Leading Practices
The adoption of industry-leading practices, operating tactics, and winning strategies helps organizations chart courses to superior dashboard performance. Leading practices include:
- Develop a Clear Strategy – Develop a clear strategy on what is expected from the Dashboard solution so it designs to live up to its purpose as an efficient and actionable BI tool.
- Develop Effective Metrics – Involve both functional and technical personnel in developing metrics.
- Plan for Real-Time – A performance management system populated with more real-time data will allow executives and managers to keep their fingers on the pulse of the organization.
- Plan for the Long Haul – Prepare for 20% growth in users, 15% growth in queries, and four to five new data sources each year. Design a system to accommodate this growth.
- Develop on a Single Platform – The risk of failing to do so is that when managers build their Dashboard solution independently of each other, the resulting Dashboard silos eventually compete with each other for resources.
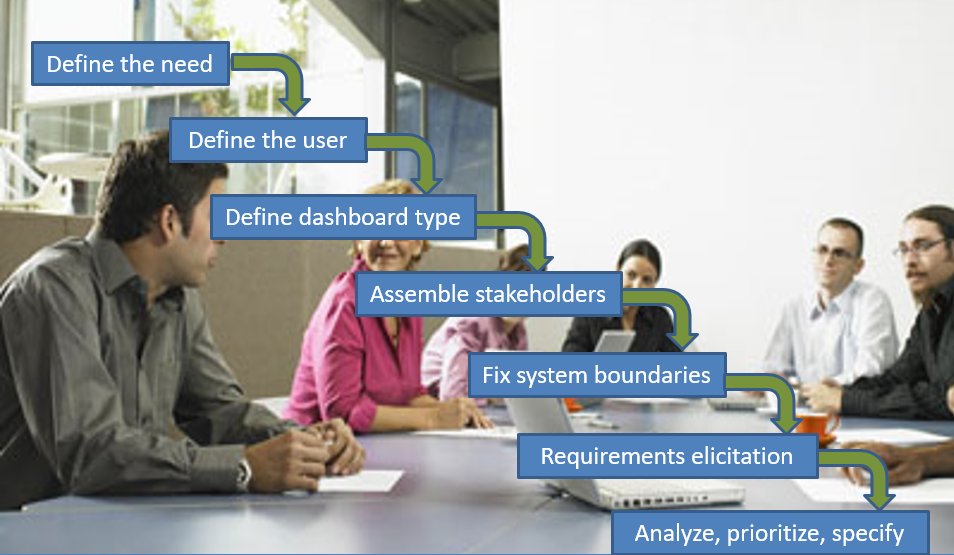
Dashboard Requirements Specification
The requirements specification process provides a structured methodology for defining the full range of organizational and technological requirements. Steps in the process include:
Conclusion
- Well-designed and developed Dashboards generally result from careful planning driven by thorough requirements specification.
- Well-designed and developed Dashboards can offer insight, explanations, and shared understanding of critical organizational information, and then allow the users to act upon the information when and where necessary.
Compiled by: M. Imran Iqbal
Imran Iqbal is a .Net and BI Developer/ Architect at Allied Consultants. His areas of expertise are business intelligence, website development, and ODOO. i.e. Microsoft PowerBI, SSRS, SSAS, SSIS, Crystal Reports, Asp.net, Asp.net MVC, WCF, WebApi, Responsive design, Angular, MySQL, SQL Server 2000, 2005, 2008, 2012, 2014, 2016, ODOO development and implementation.
He can be reached at +92-322-4745773,
Skype: mianimraniqbal,
E-mail: [email protected]