
Power Monitoring – Allied Consultants – IoT home automation
We recently did a project on the home automation side of IoT. The idea was to derive useful information related to power consumption (a big problem in our part of our world) regarding the AC premises and then take actions to
- reduce the utility costs
- Observe usage patterns and optimize it based on lowest cost of power produced
- reduce the cost of redundant power
- Improve battery life
- Improve charging efficiency
- Improve operations
- Intimate staff when action needs to be taken (e.g. when batteries need to be maintained or when Solar Panels need to be cleaned).
- And ofcourse to discover new avenues of value that we hadn’t previously felt feasible
Our setup included:
- A regular utility (LESCO/WAPDA) connection. These have both scheduled and unscheduled power outages.
- Battery panels to store energy
- Solar Panels on the roof installed with the intent of improving battery life, reducing energy costs and improving battery life.
- Backup generators in case of long term power failure
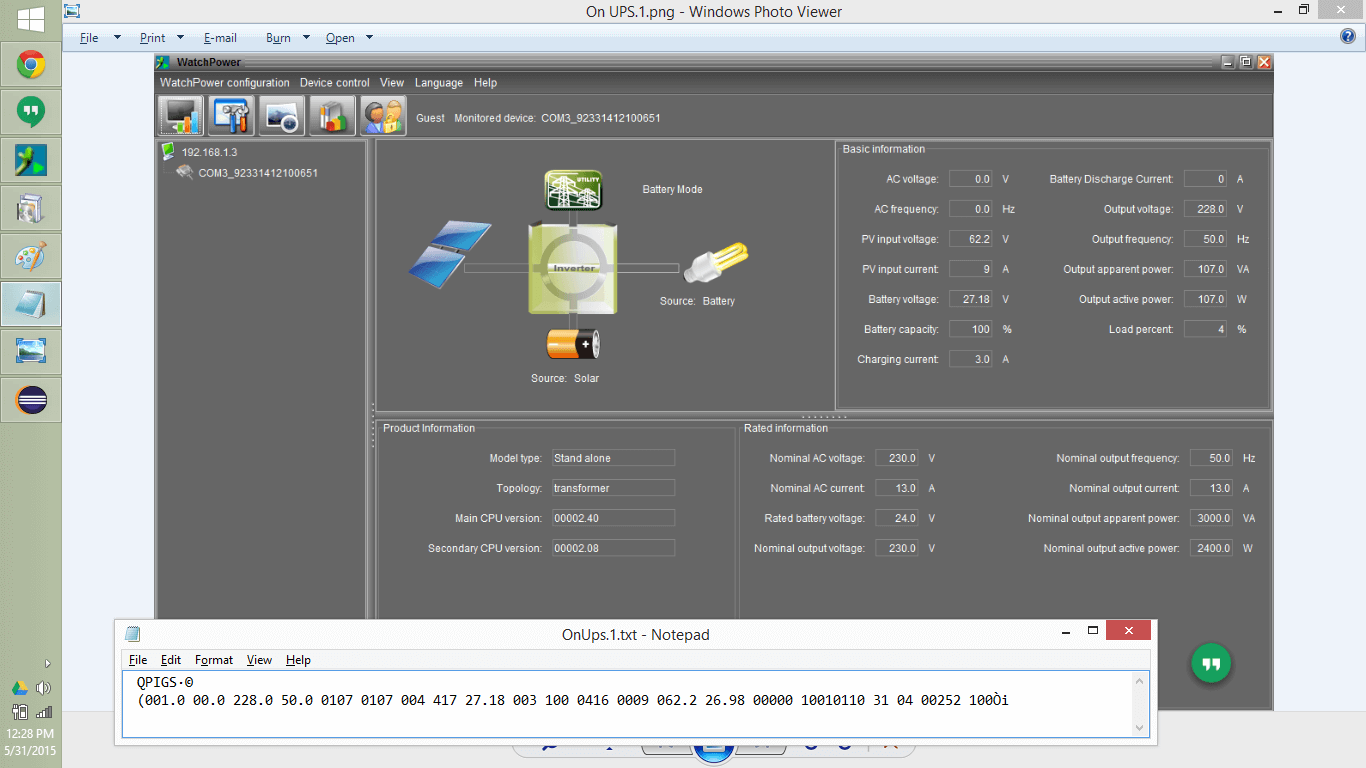
- A Smart off-grid inverter to tie things up. We bought it off Tesla but found it was a rebranded version of a company in Taiwan (MPP Solar), which in turn is using modules from Voltronics. The inverter shipped with software that you could use to see the Inverter’s internals on a computer.
Getting the data
We began to approach the problem top down initially and started looking for parameters from the power setup that would enable the analysis. E.g. we were interested in solar power produced vs. the power consumed in the premises. We realized soon that this is probably a bad idea and that while its a good view to have to keep alignment, much of the data is available in devices is available as raw metrics. Ultimately pretty much everything boils down to voltage and current and protocols. We were clear that we basically needed to get current and voltage information from various points (solar panel output wires, utility lines, battery wires etc.). We had several options:
- Use an Arduino and clamp on current sensors to gather this data. Connect the Arduino to a Wifi shield or the ESP 8266 and upload it.
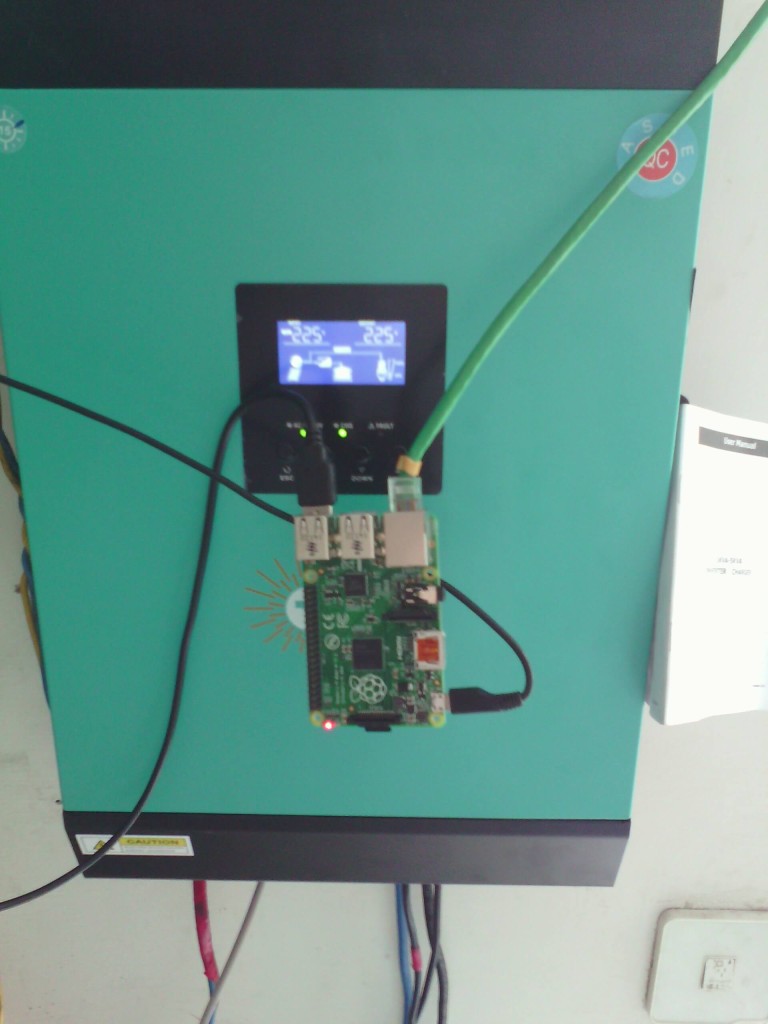
- Use a Raspberry pi and try to hook that up to the inverter (which is probably already getting all this data).
The first approach had a lot of flexibility in that it could later be moved to a more granular level (e.g. tracking a floor etc) without much change. We could just take the current clamps off and move them elsewhere however we felt the single unit approach of the later was the way to go for a reliable solution that would run reliably for long periods in harsh environments (the Solar panel boxes are pretty hot).
Cracking the code
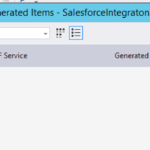
Given the approach, the first bit was being able to talk to the Inverter. As is classical in these scenarios, the hardware is proprietary and undocumented. Much of the integration was doing to happen through sniffing and protocol deconstruction. We ended up settings up a sniffer. Amongst much noise, we could see a clear request-response instruction set (bottom of the screenshot) that had a string containing most of the parameters the Inverter is tracking. We got all the ones we needed plus more (that we decided to upload anyways).
“Interneting” the thing
The first problem is a classic and probably where most of the focus for IoT will remain for the next decade. The Raspberry pi ships with a network adapter but the production module is to go with a USB WiFi Adapter given the difficulties of network access on rooftops. There is much to be desired in terms of Raspberry Pi’s WiFi Capabilities but if you are careful in your selection of adapter it works out nicely. Once connectivity was established between the Pi, the Inverter and the Internet Router we could set about capturing the data periodically and uploading it.
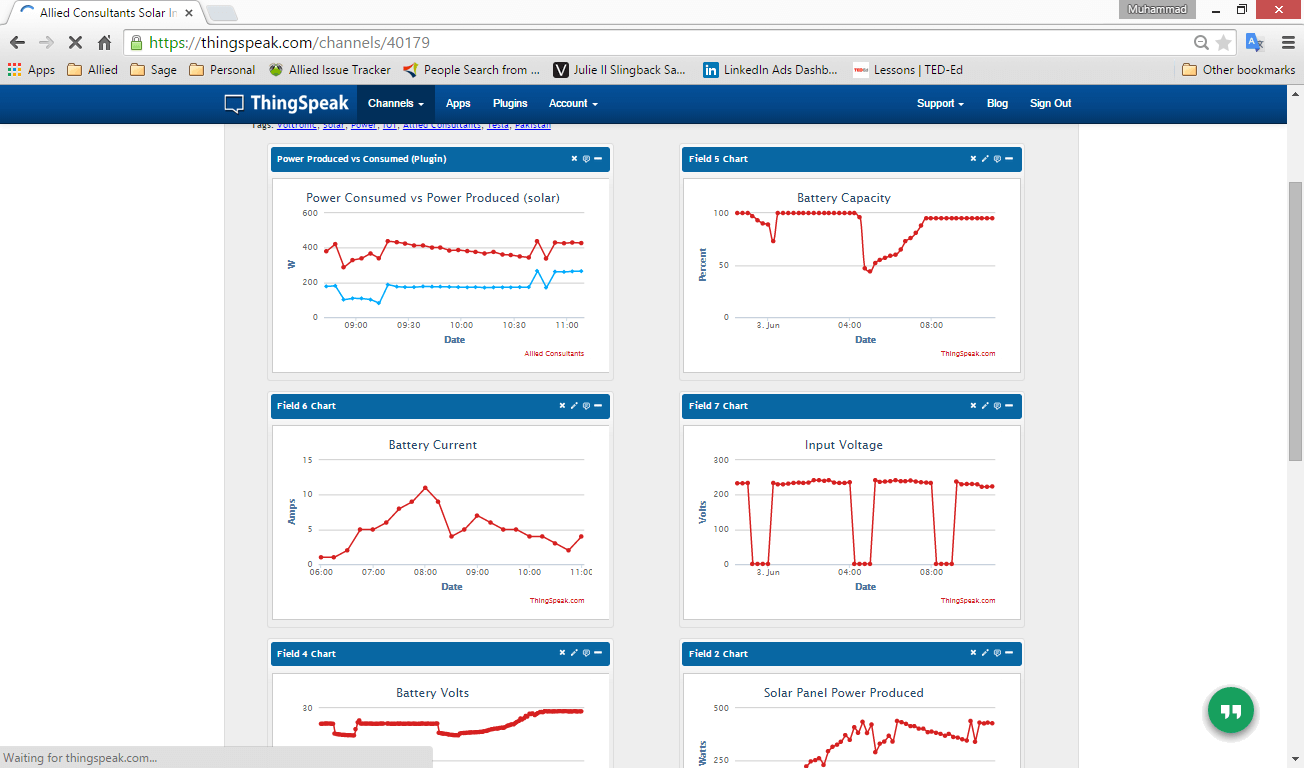
After a bit of research it seemed like the most open and quickest way to display our data was going to be via ThingSpeak. You can use a standard Java API to post information which is exactly what we did.
The end result is the dashboard below:
https://thingspeak.com/channels/40179
We added another interface for this at
http://apps.alliedc.com/Power/chart.html
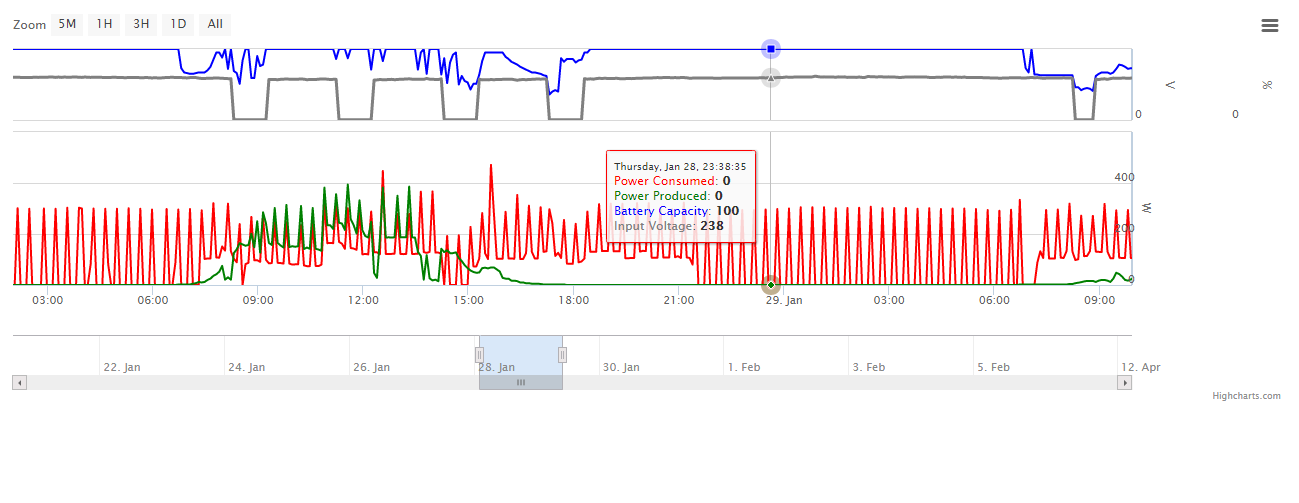
The screenshot shows about a day’s worth of data and already several interesting patterns can be seen for e.g.:
- Batteries are cycling alright at night (first dip in battery capacity) because they charge over utility. In the morning around 4am, on the next utility power outage (dip in Input voltage), the Inverter is starting to prioritize solar over utility to charge the batteries. This time it takes much longer. This opens up the potential for deeper sulphation of the batteries.
- The mid-night dip in battery capacity to 50% or so is disturbing and ideal discharge cycles should not allow batteries to drop below 80%. If this continues it would reduce the battery life from the stated 5 years to about 2, which has a YOY impact of about 5000$ for us.
- The solar power production overtakes its consumption around 8am and thereafter the setup has more power than it consumes. The batteries are full and there is nowhere for the power to go so the Inverter actually stops drawing current from the Panels after that. We can probably do energy heavy activities like cleaning during this time.
Its just been a few days but the ideas are flooding in. Here are some:
- Add weather data to this dashboard to evaluate if the Solar Panels need cleaning. Cleaning the Panels makes a big difference on their power output and if we can benchmark what power output should be like on a sunny 42 degree day, we can determine if the Panels are potentially malfunctioning.
- Current Bill / Expected bill (based on expected sunlight, weather conditions). So we are we only showing Power, not KWh (utility benchmark for pricing)
- Actual power saving from solar (given the UPS’s configuration). Actually measure the ROI of various Inverter configurations (increase battery life vs. power savings etc.)
- Alerts based on conditions. E.g. if the battery drops below 50%, I’d like an administrator to get an alert intimating him to take a look. ThingSpeak React is the tool for it. Just need to plug that in. ThingsTweet is also pretty interesting on that front.
- Anamoly detection. If the power usage on a weekend is unusually high, someone should be intimated. This could be an extra server or an employee having too much fun on the premises 🙂
- Get more detailed information on where power is consumed exactly
- Customize the ThingSpeak dashboard. The existing graphs are very basic but the provide a decent framework for customization. Will try some of this out. This and This look good to begin with. and look like great places to start
- Get our Big data guy to start processing this data and do cool things with it and discover patterns that aren’t otherwise easily visible.
Related Posts
![[New checklist] What to keep in check when planning a big data pilot?](https://alliedc.com/wp-content/uploads/2015/08/Elephant-150x150.png)


Comment (1)
Comments are closed.
Brian Henning
July 8, 2015HI
I am also looking to use a rpi to monitor my Voltronics inverter. Is it possible to share the code/ program ?